A personal data analysis project tracking 18 months of job applications across 112 companies and 37 sectors, built with R. Equal parts practical necessity and a chance to sharpen my data wrangling skills.
Some context
Looking for a job in sustainability in Switzerland in late 2024 and 2025 is not easy. Who would have guessed that Trump would have been reelected, causing human right and sustainability-related programs to be defunded, and the new CSRD from the EU Commission to be significantly lightened? I wouldn’t have. And I certainly would not have predicted the effect on my job hunting.
The hardest part is feeling powerless. Feeling like I’m being carried away by external forces. To counter this feeling, I tried to find ways to regain control over the situation. (I know, this may seem like a sentence taken out of a scammy personal growth leader organization, the ones that say you have to reset your mindset by buying an awfully expensive package of books and conferences.) The idea is just to own as much as possible what happens to me and be more active about it, despite the fact that much is indeed out of my control.
I won’t lie, this is an uncomfortable situation, but it’s not the first and will certainly not be the last time I face this type of challenge. So it’s on me to find the opportunities to learn and enjoy this time as much as possible.
So, I decided to use tools I learned to use this past year: the R coding language, and Power BI. And what better dataset should I use than the one on my job search? Since I had been tracking applications for my unemployment agency and for my own sake, it had become a genuine data story after more than a year. I therefore realized that this would give me a unique opportunity to analyze retrospectively my efforts and the positions I have applied to. It could result in unexpected insights and/or very obvious correlations, while refreshing my coding knowledge.
I should also mention that I used AI (Claude.ai and ChatGPT) as a sounding board throughout, not to do the work for me, but to suggest code, catch my mistakes, propose visualisations, and challenge my interpretations. This experience encouraged me to learn more about how to best utilize it while combining it with my other skills.
Main highlights
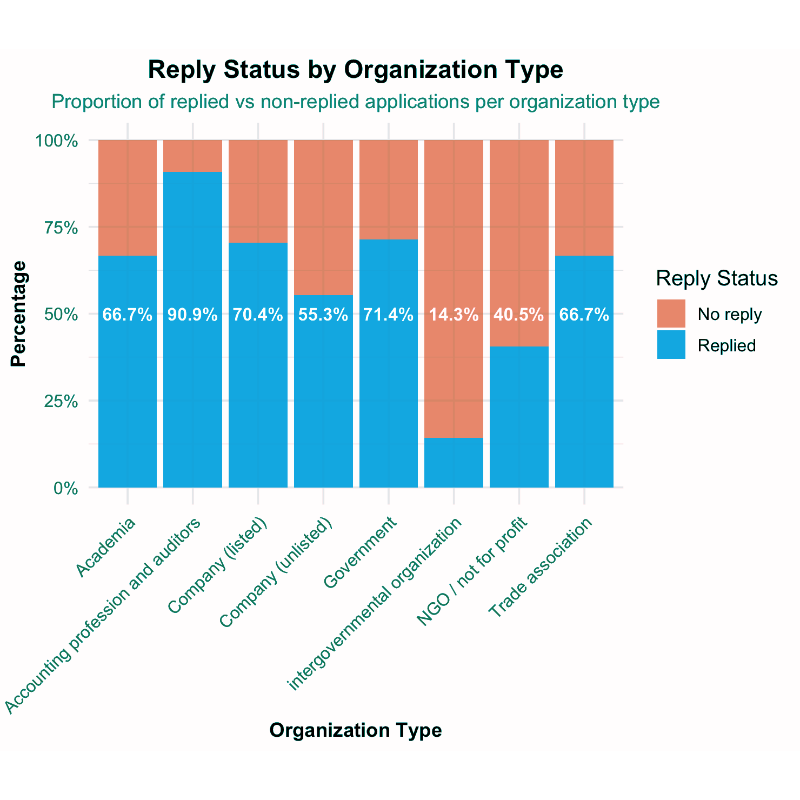
Between March 2024 and September 2025, I tracked and analysed 170 job applications across 37 sectors, with a focus on sustainability roles. The overall reply rate of 48.8%, nearly double the industry average of 25%, varied significantly by organisation type: accounting and auditing firms replied to 90% of applications, while intergovernmental organisations responded to just 14%. Statistically, both sector and organisation type were found to significantly influence employer responsiveness, suggesting that who you apply to matters more than when or how often.
Read my full report below
(I might still fine-tune it later on)
In addition to this in-depth analysis, I thought a Sankey Diagram would illustrate well my applications' flow over two years (2024-2026). A few numbers are worth highlighting:
- 50.7% of applications got no response
- 44.9% were rejected without an interview
- 4.4% led to an interview, and of those, 30% resulted in an offer
I used Claude.ai to build the Sankey Diagram